
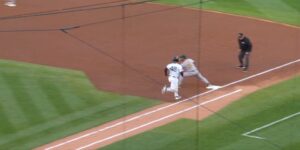
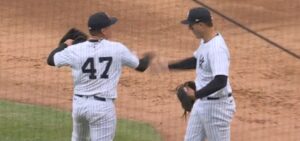
Luis Gil (#81, 26, RHP, 1-1, 2.75) vs. Colin Rea (#48, 33, RHP, 2-0, 2.08) YANKEES SS...
From Bill Ladson: The Yankees had A’s left-hander Alex Wood on the ropes throughout Thursday’s game at...

Alex Wood (#57, 33, LHP, 0-2, 7.89) vs. Nestor Cortes (#65, 29, LHP, 1-1, 3.41) ATHLETICS LF...
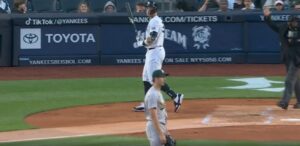
From Bryan Hoch: Whenever Aaron Judge and Juan Soto hit home runs in a game, good things...
Joe Boyle (#35, 24, RHP, 1-3, 7.23) vs. Clarke Schmidt (#36, 28, RHP, 1-0, 3.15) ATHLETICS 1B...
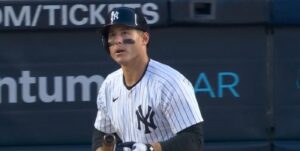
From Bryan Hoch: April has never been Anthony Rizzo’s favorite month, with raw weather conditions and early-season...
Paul Blackburn (#58, 30, RHP, 2-0, 1.08) vs. Marcus Stroman (33, RHP, 1-1, 2.42) ATHLETICS CF Esteury...
From Bryan Hoch: One after another, the Yankees made hard right turns back to their dugout on...
JP Sears (#38, 28, LHP, 1-1, 4.35) vs. Carlos Rodón (#55, 31, LHP, 1-1, 3.66) ATHLETICS CF...
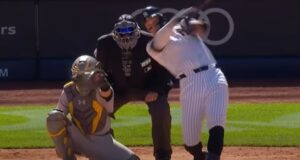
From Bryan Hoch: It was the top of the third inning on Sunday, and Luis Gil’s frustration...